
As applications evolve with new features and increased number of users, engineering the performance at the new scale is one of the critical activities in every release. In this series of articles, I will discuss ‘performance engineering’ in a way that would appeal to a broad spectrum of audience, from software engineers to architects.
User’s expectations about the time taken by an application to complete the task they initiated determine whether the application performance is acceptable or not. We begin this series with this user perspective and discuss some measurements at the user end and see what it tells us at the highest level of abstraction of the application architecture.
As we move forward in the series, we will go deeper and explore lower levels of abstractions and discuss performance engineering at that level.
End user perspective of performance
For end users, application performance is good if the time taken by the application to carry out any task is within acceptable limit. For majority of web, mobile or desktop applications, this acceptable time limit is less than 2 seconds. For real time and mission critical applications, the acceptable limit is in terms of fraction of seconds depending on the nature of the application.
The time taken by an application to perform a task initiated by a user, is called the application’s response time for that task. An application that almost always responds within acceptable time limit is considered to demonstrate good performance. An application whose response time is frequently outside acceptable limits (for many application functions), is said to have performance problems.
Constituents of response time
Let us take the definition of response time and identify its constituents for a web application (or a web site). Let us start with the highest level of abstraction of the web application as a client server application. The client component runs in the browser on the client device and the server component runs on the server computer. The communication between the client and the server takes place over internet using the HTTP/HTTPS protocol. The following diagram shows this structure including communication between the client and server to get the work done.
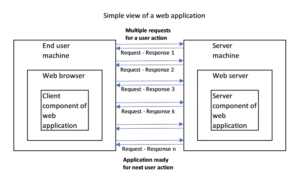
A typical sequence of requests and responses in a web site/web app are as follows:
- User types a URL in browser’s address box.
- Browser sends GET request to the server.
- Server sends back a response containing HTML having elements to display as well as locations from where fonts, stylesheets and scripts need to be fetched.
- Based on response in 3 above, multiple GET requests are made by the browser to get all the relevant client components of the application.
- Based on the interaction of the user with the client component of the application, a series of HTTP requests are made by the application code which fetches more data from (or sends data to) the server components of the application and show / hide more HTML elements.
The diagram below depicts this as interaction between various components shown in the logical architecture. The requests being sent to the server and server component of the application and the resulting responses processed by the browser and/or the client component of the application are seen in the diagram. As the responses get processed, the user sees the outcome in terms of the changes seen in the browser tab/window corresponding to the web application.
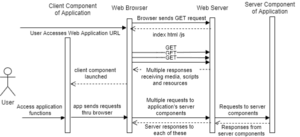
Response time being the time taken to complete the user-initiated task, we can see that the time to complete the user-initiated task is composed of time taken by various components in the architecture in serving the requests and handling the responses.
Time taken by each request is composed of time taken by these components themselves as well as the time to send the requests and receive the responses. Hence, the response time of a web application can be seen to be composed of:
- Time taken by browser component
- To initiate the request,
- To establish the communication link with the server
- Time taken to send the request over the network component to deliver it to the server
- Time taken by server and server components of the application to compute the response,
- Time taken to receive the data over the network component, and
- Time taken by browser and/or client component of the application to crate and send the request, process the response, and show the results to the user
As many of these requests are concurrent, the actual elapsed time of user action is not a simple sum of the time taken from creation of request to handling the response. The actual time taken by the task (and concurrent execution of the constituent requests) is understood better when we look at a time chart, where entire life cycle of each request is plotted in chronological order of execution.
Browser’s developer tools provide us such details of each request. These details along with knowledge of application helps us map a user action to a set of requests and then see the response time on the chart to identify the requests that have major contribution to the response time.
Response time measurement in browser
To understand the ‘requests, responses, and timings’ through an actual web application, as discussed in the points ‘a’ to ‘e’ above, let us look at data for a web application shown by the browser’s developer tools.
We take the instance of the timing details of Government of India’s CoWin web application.
The network tab of the developer tools shows a view of all the requests and their details as shown in the figure below.
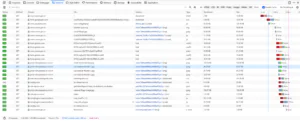
Figure 1: High level view of multiple requests made by the application to its server components
The figure shows the initial set of requests made by the client component and timings on a timeline. At a high level we notice that there are several requests sent to the server as a result of single user action of typing the web application URL in the browser. We also see that many of these requests are concurrent. This is due to HTML processing by browser resulting in concurrently downloading stylesheets, scripts, media, and so on.
When we click on a specific request, we get the details of the time taken by various components of the application (as seen from the browser)
Details of timing for the first request to www.cowin.gov.in are shown below:

Figure 2: Details of timing for one of the requests
The request to www.cowin.gov.in (to load the initial page of the application) had the following time measurement in the browser:
| Time Measured | What it Means |
|---|---|
| Blocked time | Time before browser begins processing the request (received from the user) |
| DNS resolution time | Time taken by browser to discover the IP address of the server to which the request is to be sent |
| Connecting and TLS Setup time | Together represents the time taken by browser to establish secure network connection with the server (TLS Setup time will be zero if secure transmission protocol is not specified in the URL) |
| Sending time | Time taken to send the request to server |
| Waiting time | Time for which browser had to wait before the first byte of response was received |
| Receiving time | Time taken to receive the entire response |
As the time measurement is made from the browser, all the times are after the browser accepts the request from User / code in client component of the application. Hence, it is important to note the following:
- Time taken by the code in client component of application running in the browser is not captured in this measurement. This time consists of the following two parts
- Time taken by client component in recognizing the user action, creating the request and handing it over to the browser, and
- Time taken by client component to process the response and display the results on the user interface
- Time taken by the code in client component of application running in the browser is not captured in this measurement. This time consists of the following two parts
This means that application’s client component needs to measure these time components on its own, if it wants to enable any diagnosis of client component’s performance.
- Blocked Time, DNS resolution time, Connecting and TLS setup time is time taken by browser before request is sent over the network. As browsers have a limit on maximum simultaneous connections to a domain, you would notice blocked time in some of the concurrent requests to the same domain. You would notice that in figure 1 above.
- Waiting time is the total time taken by server and all the downstream components to respond to the request. This means that time taken by individual server components is not captured.
The measurements are being taken at the browser level, it is therefore natural that the details of server components are not available at this level of abstraction, hence not present in the measurement. - Sending time + Receiving time is the time taken for data transfer over network. This is dependent on size of data transferred and the bandwidth of the slowest portion of the link.
Analysis of application’s response time behavior at this level
We know the following:
- Response time equals time taken to complete the user-initiated task.
- User-initiated task translates to several HTTP requests. Some of these are concurrent and some are sent after completion of others.
Hence, to compute response time for a user-initiated task we need the following details:
- Mapping between user-initiated tasks and the requests that are part of it.
- Timing details of each of these requests.
Mapping requires low-level design knowledge and timing details come from runtime measurement. Once we have this information, the response time taken to for any user-initiated task is computed using start and end time of each of the constituent requests.
If R is a set of constituent requests for a user-initiated task, then the response time for that user-initiated task is computed as follows:
Note start time and end time of all the requests in the set R.
Identify least start time and highest end time from these requests.
The difference between the highest end time and least start time from these requests is the response time for that user-initiated task.
The individual request(s) which have significant contributions are the ones which would need further drill down. This requires us to go to the next level of decomposition of the architecture.
In future articles, we will continue this drill down and continue our performance engineering journey.


